Why investors can be thankful after a volatile year

Eagle Wealth Management |

While it may not feel like it, investors do have much to be thankful for this holiday season.

Over the past year, investors have navigated both short-term challenges due to interest rate swings, the banking crisis, and political battles in Washington, as well as long-term uncertainty resulting from inflation, the Fed, geopolitical conflicts, and more.

And yet, through all of this, major market indices have held onto strong gains, reversing much of last year's declines.

So how do we maintain perspective as we reflect on the past year?


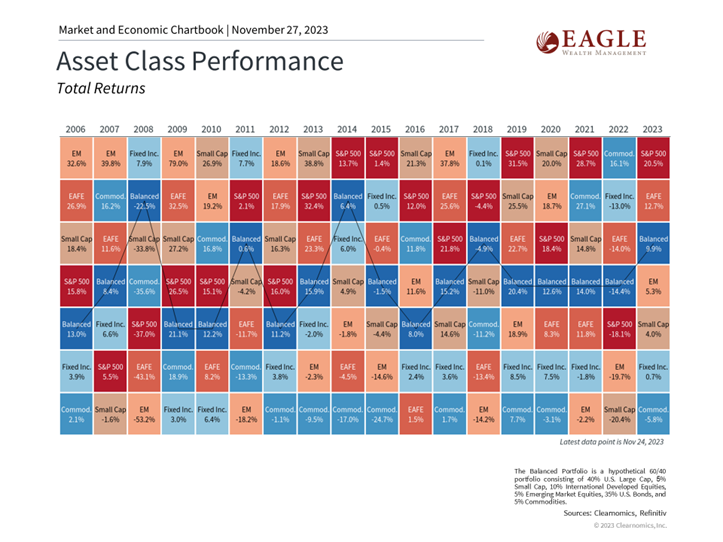
Many major asset classes have made strong gains this year:

Financial markets and the economy have defied expectations in 2023. In many ways, the current environment represents the best-case scenario for which investors and economists could have hoped just a year ago.
 

With only five weeks left in the year, the S&P 500 has returned 19.3% with dividends, the Nasdaq 36.0%, and the Dow 7.5%. International stocks have also performed well with developed markets gaining 11.5% year-to-date and emerging markets 4.8%.

Interest rates climbed throughout the year but have retreated in recent weeks. The 10-year U.S. Treasury yield, for instance, has declined from just above 5% to just under 4.5%. While a diversified bond portfolio has only returned about 1% this year, this is far better than last year's historic bear market decline.

An important reason for these gains is the health of the economy. One year ago, economists expected a recession by the second half of the year due to Fed rate hikes and early signs of stalling growth. But this didn’t happen. Instead . . .

  • Job market - one of the strongest in history with unemployment near 3.9%
  • GDP growth - 3rd quarter growth at a 4.9% annualized rate, one of fastest in recent decades.
  • Consumer spending – strong throughout the year and helped drive the demand side of the economy as the supply side recovers.
  • Corporate profits – some signs show they may be ready to turn around after three quarters of falling earnings.
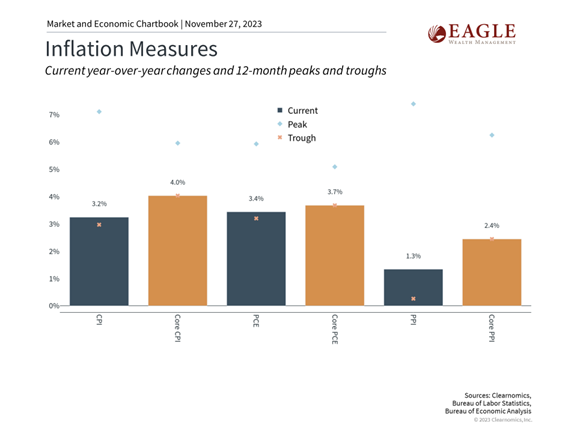
  • Inflation – improved significantly, with the Consumer Price Index (CPI) in the 3% range on a year over year basis, down from a high of 9/1%.
     

Check out this chart on how inflation has improved:


Unfortunately, slowing inflation rates do not mean that prices will decline - only that they will rise at a slower pace. While this provides some relief, many households, especially those in or near retirement, may continue to find higher prices challenging. 

From an investment standpoint, however, both stocks and bonds have already benefited from greater price stability. The fact that the Fed may be near the end of its rate hike cycle only adds to the tailwinds that have propelled markets this year.

What to do?  Staying invested is still the best way to achieve financial goals.


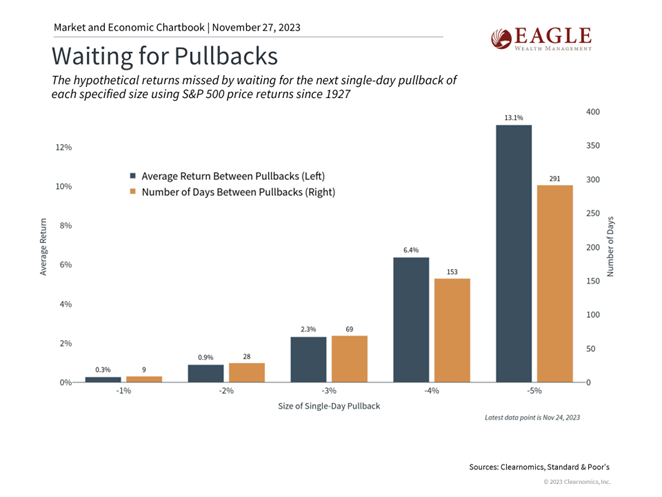
One lesson that this past year underscores is the importance of sticking to a financial plan. While it's tempting to try and time the market, history shows that it's often better to simply be invested. 

This is because markets tend to rise over long periods of time, making both higher highs and higher lows. The chart below shows that investors often wait long periods before the next pullback and, in doing so, forego periods of healthy returns.


The bottom line? Investors do have much to be thankful for this year. This can be difficult to recognize since it often feels as if markets move from one crisis to another. With the benefit of perspective, it's easy to see that the economy and financial markets have come a long way, hopefully setting the stage for investors to achieve their long-term financial goals.


Medicare Open Enrollment Ends December 7th


The Medicare open enrollment deadline is swiftly approaching on December 7th, 2023. This is your last chance to review your current plan and make any changes that better suit your needs for the upcoming year.
 
Importantly, St. Charles Hospital in Bend will no longer accept Medicare Advantage plans offered through Humana, HealthNet and WellCare which will affect around 6,000 seniors in our area. If you’re one of them, we recommend you review your options immediately.

St. Charles WILL still accept PacificSource, Providence, Moda, And Regence Blue Cross Blue Shield for 2024. Read more here.
 
If you need some last-minute help, don’t hesitate to reach out to our team.  We have some recommendations for Medicare Insurance specialists in the area that can help you with this decision, but please reach out ASAP since the deadline is rapidly approaching.


Eagle Wealth helps local club launch photography book


Looking for a gift idea?  With a little sponsorship help from Eagle Wealth and Visit Central Oregon, our friends at Cascade Camera Club created a beautiful 11” x 11” high-quality photography book all about Central Oregon with images by 42 of their members, including some nationally acclaimed photographers.
 
The book was created through thousands of volunteer hours from dedicated club members, and all proceeds go right back into the 100% volunteer-run club.


Come to their book launch party during the First Friday Art Walk at Bend Lift Fitness Studio, 514 NW Franklin Ave., from 5:00pm - 9:00pm on December 1st
 
Drop by, have a glass of wine, view some photographs for sale, buy a book, and meet some of the photographers who made this book happen!
 
Books will be available in person at the First Friday celebration or online
. All proceeds go directly to the camera club to bring educational opportunities for the local community and help with other club expenses.
 
Read more about the book and see some of the photos on their Kickstarter campaign website
.
 
About Cascade Camera Club:
The Cascade Camera Club is roughly 90 Central Oregon photographers of all levels who meet twice a month in Bend, Oregon.  The club is 75 years old and continues to thrive because of the supportive atmosphere, the generous involvement of outstanding local professionals, and the outstanding photo opportunities in Central Oregon. Please join them at the Larkspur Community Center on the first and third Mondays of the month at 6:30pm.


The Week on Wall Street

Investor enthusiasm for stocks remained strong last week, buoyed by declining bond yields in a holiday-abbreviated trading week.

The Dow Jones Industrial Average picked up 1.27%, while the Standard & Poor’s 500 gained 1.00%. The Nasdaq Composite index rose 0.89% for the week. The MSCI EAFE index, which tracks developed overseas stock markets, was flat (+0.03%).1,2,3


Falling Yields Lift Stocks

The stock market continued to look toward the bond market for direction, responding positively to bond yields that fell steadily for much of the week. A successful 20-year Treasury notes auction on Monday triggered a decline in bond yields. The release of the minutes from the Fed’s last meeting buoyed investor optimism that the potential for further rate hikes was diminishing.

Investor sentiment was also lifted by the earnings results from a leading mega-cap, AI-enable chipmaker that topped analysts’ expectations, bolstering the narrative of AI’s potential to help corporate profits. Despite a higher turn in bond yields on the final half-day of trading, stocks retained the week’s gains.


Fed Minutes

Minutes from the October 31–November 1 meeting of the Federal Open Market Committee were released last week, providing insight into its decision not to raise rates and its thinking on the future direction of interest rates.

The minutes reflected concerns by committee members that inflation remained stubborn and may move higher. The minutes also reaffirmed the messaging of many Fed officials, including Fed Chair Powell, that monetary policy must remain restrictive until they are convinced inflation will be on track for the Fed’s two percent target. They further said that future rate decisions will be based on fresh economic data, offering no indication that a rate cut was forthcoming, as many analysts are increasingly anticipating for 2024.


Any companies mentioned are for informational purposes only, and this should not be considered a solicitation for the purchase or sale of their securities. Any investment should be consistent with your objectives, time frame, and risk tolerance


1. The Wall Street Journal, November 24, 2023.

2. The Wall Street Journal, November 24, 2023.

3. The Wall Street Journal, November 24, 2023.

Charts:

Asset Class Performance Chart - The balanced portfolio is a hypothetical 60/40 portfolio consisting of 40% US large Cap, 5% small cap, 10% international developed equities, 5% emerging market equities, 35% us bonds and 5% commodities.

Inflation Measures - Bureau of labor statistics, bureau of economic analysis

Waiting for Pullbacks - Clearnomics, Standard & Poors

Copyright (c) 2023 Clearnomics, Inc. All rights reserved. The information contained herein has been obtained from sources believed to be reliable, but is not necessarily complete and its accuracy cannot be guaranteed. No representation or warranty, express or implied, is made as to the fairness, accuracy, completeness, or correctness of the information and opinions contained herein. The views and the other information provided are subject to change without notice. All reports posted on or via www.clearnomics.com or any affiliated websites, applications, or services are issued without regard to the specific investment objectives, financial situation, or particular needs of any specific recipient and are not to be construed as a solicitation or an offer to buy or sell any securities or related financial instruments. Past performance is not necessarily a guide to future results. Company fundamentals and earnings may be mentioned occasionally, but should not be construed as a recommendation to buy, sell, or hold the company's stock. Predictions, forecasts, and estimates for any and all markets should not be construed as recommendations to buy, sell, or hold any security--including mutual funds, futures contracts, and exchange traded funds, or any similar instruments. The text, images, and other materials contained or displayed in this report are proprietary to Clearnomics, Inc. and constitute valuable intellectual property. All unauthorized reproduction or other use of material from Clearnomics, Inc. shall be deemed willful infringement(s) of this copyright and other proprietary and intellectual property rights, including but not limited to, rights of privacy. Clearnomics, Inc. expressly reserves all rights in connection with its intellectual property, including without limitation the right to block the transfer of its products and services and/or to track usage thereof, through electronic tracking technology, and all other lawful means, now known or hereafter devised. Clearnomics, Inc. reserves the right, without further notice, to pursue to the fullest extent allowed by the law any and all criminal and civil remedies for the violation of its rights.

Indexes are unmanaged representations of the broader markets and not available for direct investment. Index returns do not reflect a deduction for fees or expenses. The S&P 500 Index, or Standard Poor's 500 Index, is a market capitalization weighted index of 500 leading publicly traded companies in the U S It is not an exact list of the top 500 U S companies by market cap because there are other criteria that the index includes. The Nasdaq 100 Index is an index composed of the 100 largest, most actively traded U.S. companies listed on the Nasdaq stock exchange. The U.S. Treasury 10-year Note is a debt obligation issued by the United States government that matures in 10 years. A 10-year Treasury Note pays interest at a fixed rate once every six months and pays the face value to the holder at maturity.

Investing involves risks, and investment decisions should be based on your own goals, time horizon, and tolerance for risk. The return and principal value of investments will fluctuate as market conditions change. When sold, investments may be worth more or less than their original cost.

The forecasts or forward-looking statements are based on assumptions, may not materialize, and are subject to revision without notice.

The market indexes discussed are unmanaged, and generally, considered representative of their respective markets. Index performance is not indicative of the past performance of a particular investment. Indexes do not incur management fees, costs, and expenses. Individuals cannot directly invest in unmanaged indexes. Past performance does not guarantee future results.

The Dow Jones Industrial Average is an unmanaged index that is generally considered representative of large-capitalization companies on the U.S. stock market. Nasdaq Composite is an index of the common stocks and similar securities listed on the NASDAQ stock market and is considered a broad indicator of the performance of technology and growth companies. The MSCI EAFE Index was created by Morgan Stanley Capital International (MSCI) and serves as a benchmark of the performance of major international equity markets, as represented by 21 major MSCI indexes from Europe, Australia, and Southeast Asia. The S&P 500 Composite Index is an unmanaged group of securities that are considered to be representative of the stock market in general.

U.S. Treasury Notes are guaranteed by the federal government as to the timely payment of principal and interest. However, if you sell a Treasury Note prior to maturity, it may be worth more or less than the original price paid. Fixed income investments are subject to various risks including changes in interest rates, credit quality, inflation risk, market valuations, prepayments, corporate events, tax ramifications and other factors.

International investments carry additional risks, which include differences in financial reporting standards, currency exchange rates, political risks unique to a specific country, foreign taxes and regulations, and the potential for illiquid markets. These factors may result in greater share price volatility.

Please consult your financial professional for additional information.

This content is developed from sources believed to be providing accurate information. The information in this material is not intended as tax or legal advice. Please consult legal or tax professionals for specific information regarding your individual situation. This material was developed and produced by FMG Suite to provide information on a topic that may be of interest. FMG is not affiliated with the named representative, financial professional, Registered Investment Advisor, Broker-Dealer, nor state- or SEC-registered investment advisory firm. The opinions expressed and material provided are for general information, and they should not be considered a solicitation for the purchase or sale of any security.  Copyright 2023 FMG Suite.